106 search results for “early energy modeling and comparing tools validate results”
Projects

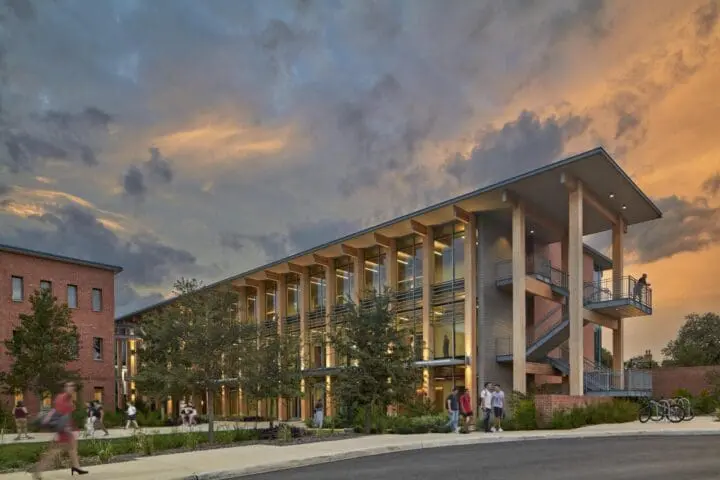
Ryerson Woods Education Facility
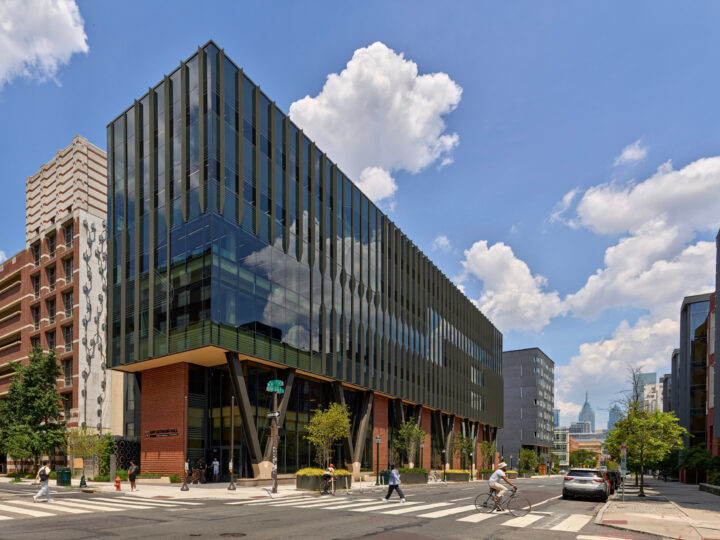
University of Pennsylvania Amy Gutmann Hall
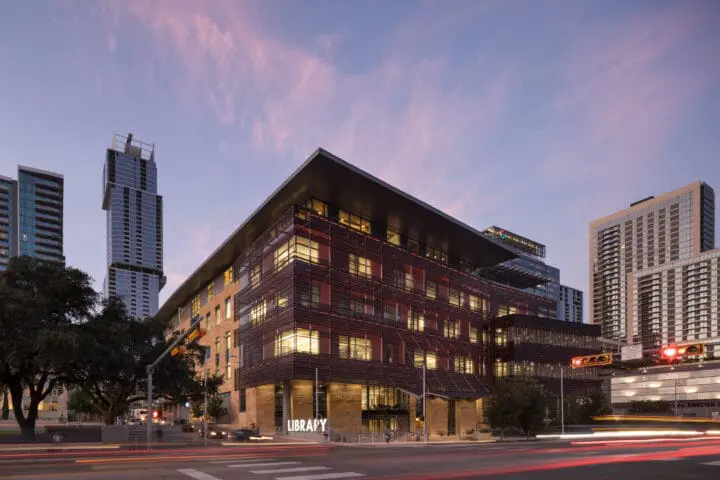
Austin Central Library
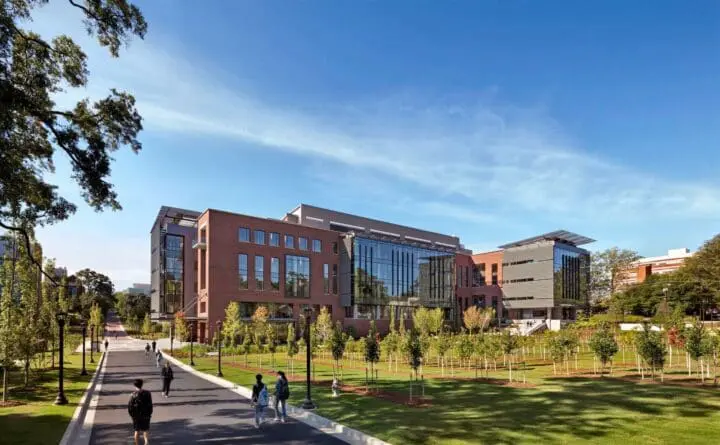
Georgia Tech Krone Engineered Biosystems Building
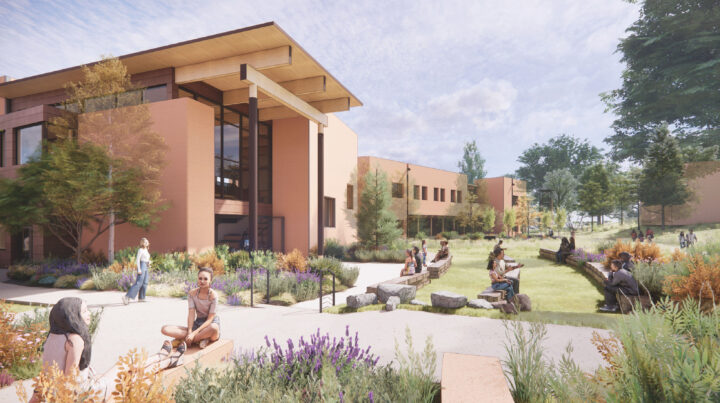
NorthWest Arkansas Community College
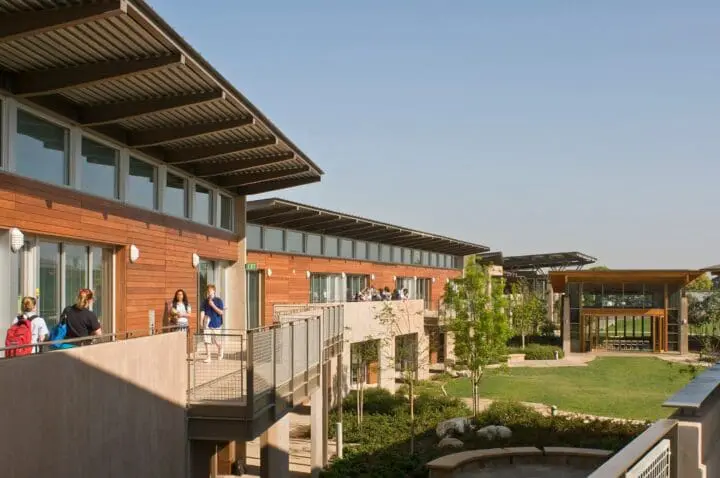
Francis Parker School
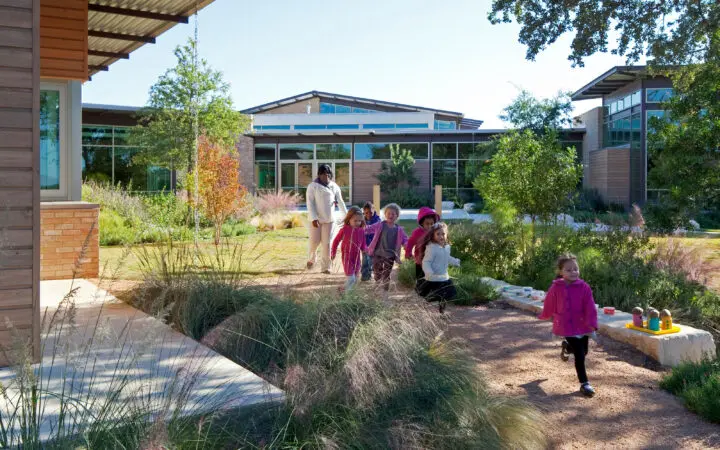
Sunshine Cottage School for Deaf Children

Medina Community Library Rodney Camp Pavilion
The Prow
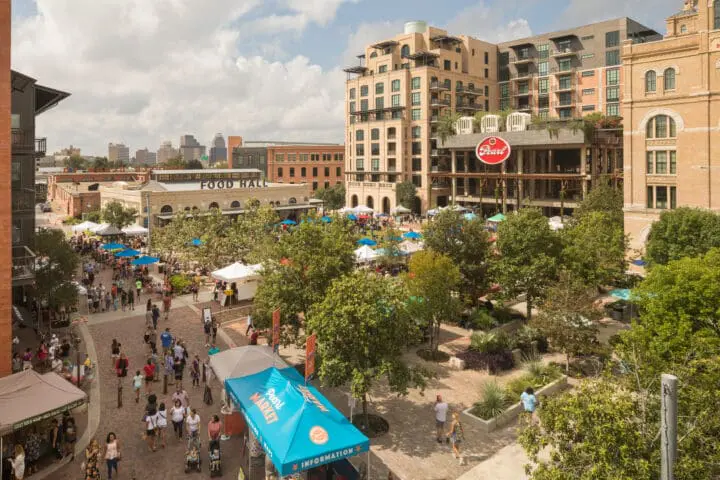
Pearl Brewery Redevelopment
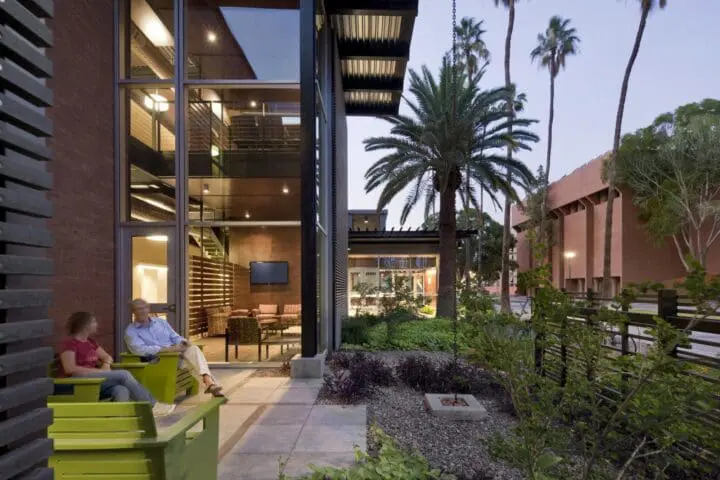
Arizona State University Health Services Building
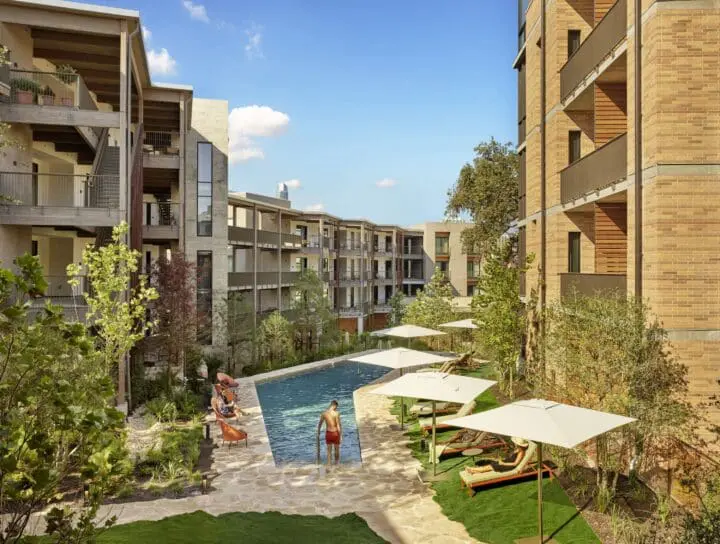
Hotel Magdalena
Fountain Valley School
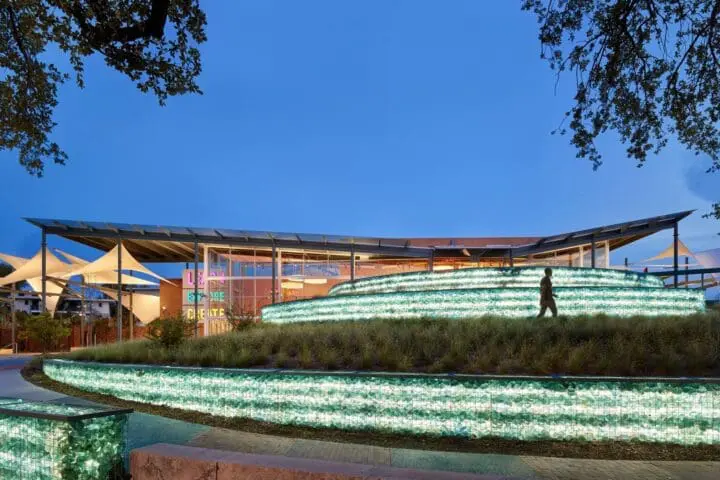
San Antonio Children’s DoSeum
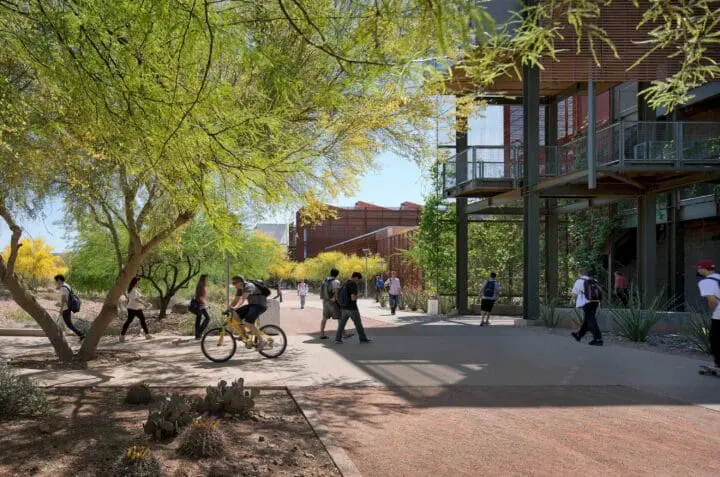
Arizona State University Polytechnic Academic District

Alamo Beer Brewery
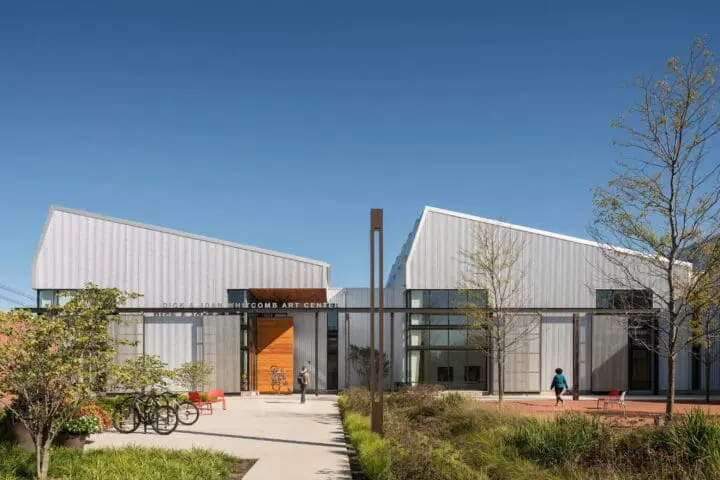
Knox College Whitcomb Art Center
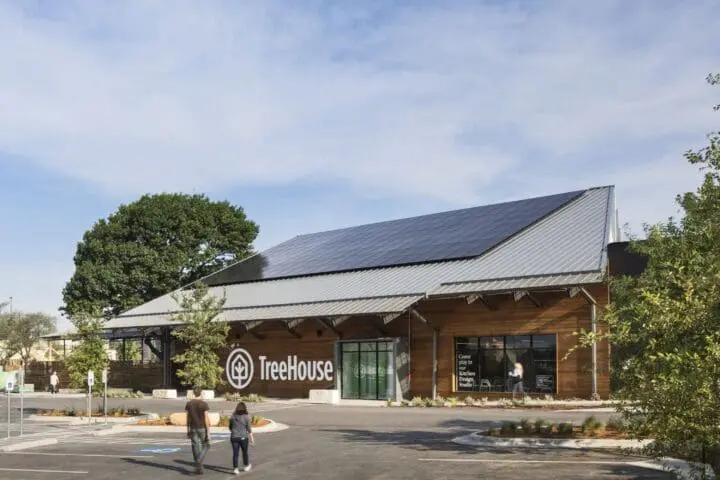
TreeHouse
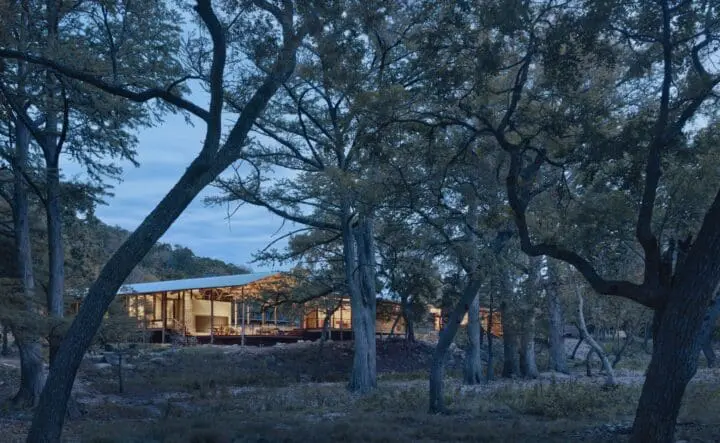
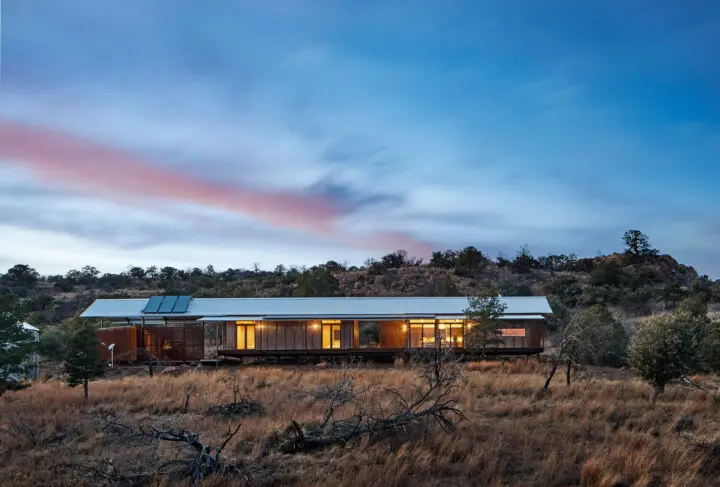
Verde Creek Ranch
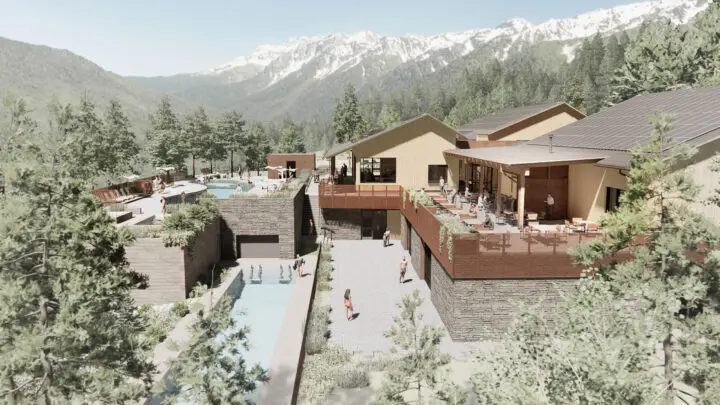
Aspire at Spanish Peaks
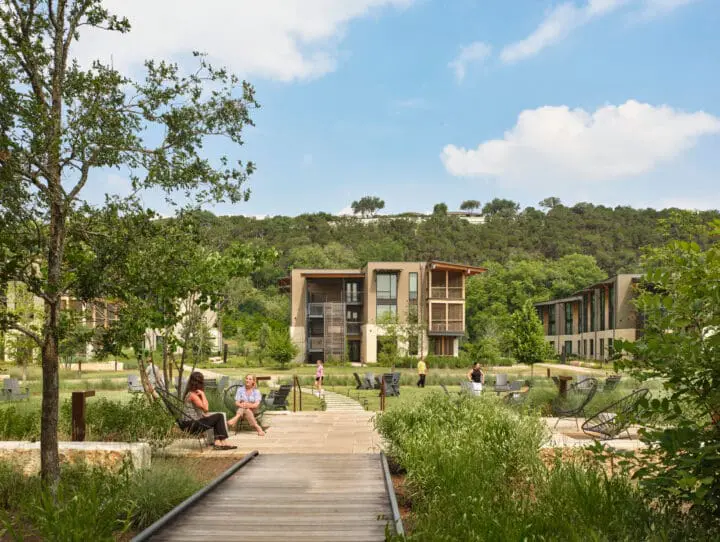
The Holdsworth Center
Trinity University Dicke Hall + Business and Humanities District
