THE DOGRUN
a place to share ideas


A NEW ADDITION TO LF's ENERGY MONITORING PROJECTS
Posted by Hayley Johnson on 5/6/15 at 1:29 pm
As part of our goal to monitor energy use in every Lake | Flato project, we've outfitted another house with its own eMonitor. These monitors test our ability to design energy efficient buildings, allow clients to control their energy consumption and give us the information we need to improve our practice.
Throughout the design process we chose passive systems, insulation, glazing, lighting and HVAC systems using energy modelling software to predict energy use. The performance of our projects is tested during post-occupancy; eMonitors provide us with up-to-the-minute data from every circuit in the building.
Last week a team of LFers made a trip to Marble Falls where we worked with electricians to install the eMonitor hardware. As construction is nearing completion, it's a great time to begin tracking energy.
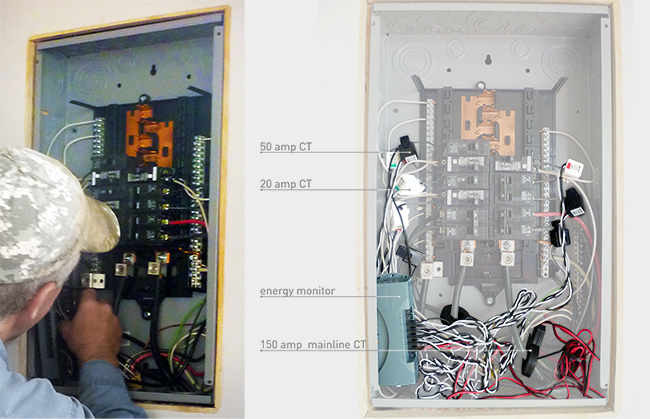 The panel in the garage is seen before the installation (left) and after (right). Current transformers (CTs) are clipped onto each circuit and run to the eMonitor, these components are hidden behind the panel. The eMonitor uses a radio signal to communicate with the gateway, which is located outside the panel and sends data to a web account via the internet.
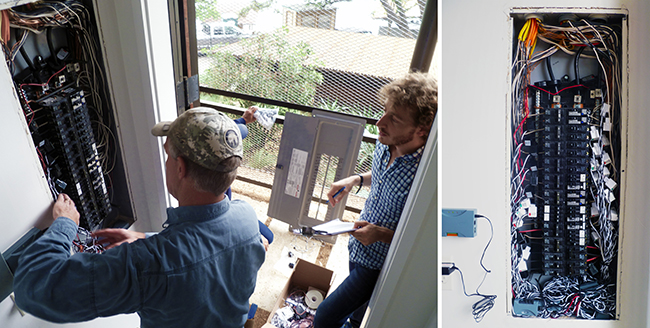 The electrician sets up the eMonitor in the house panel as Corey verifies the sensor size and channel each circuit is connected to.
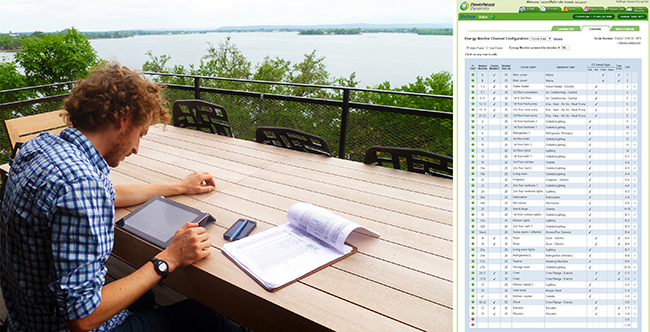 Setting up the software was a pleasant task on the third floor deck of the lake house. Once all the circuits were added to the program, energy monitoring began! Information is updated every minute.
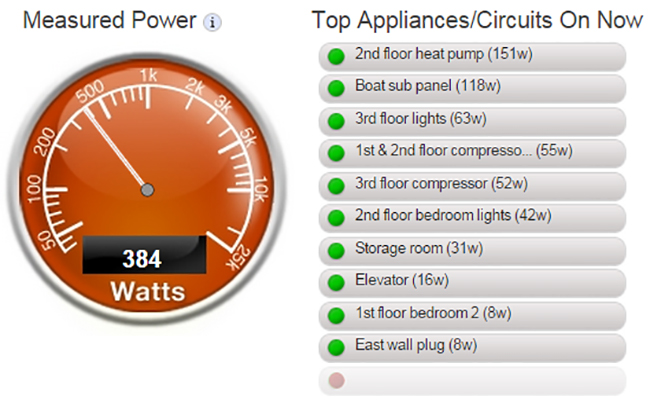 Data is displayed by logging onto the eMonitor's online account. The top 10 consuming circuits are displayed and constantly updated, revealing what is currently in use.
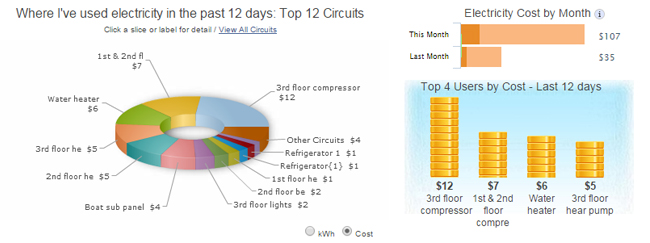 The percentage of energy used by each circuit is displayed as well as how much it costs to run each circuit.
 Charts display the building's energy use over the period of a day, week, month and year.
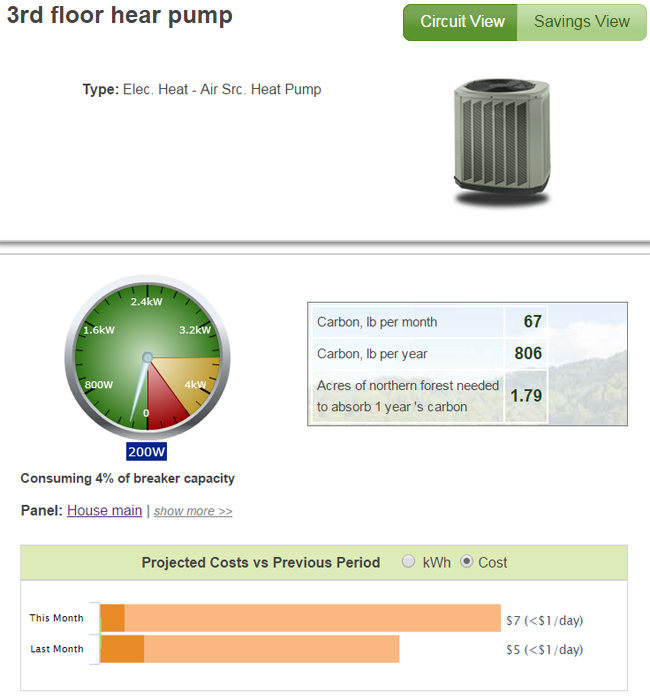 Individual circuits are tracked by the percentage of breaker capacity they use, what it costs to run the circuit and its carbon footprint.
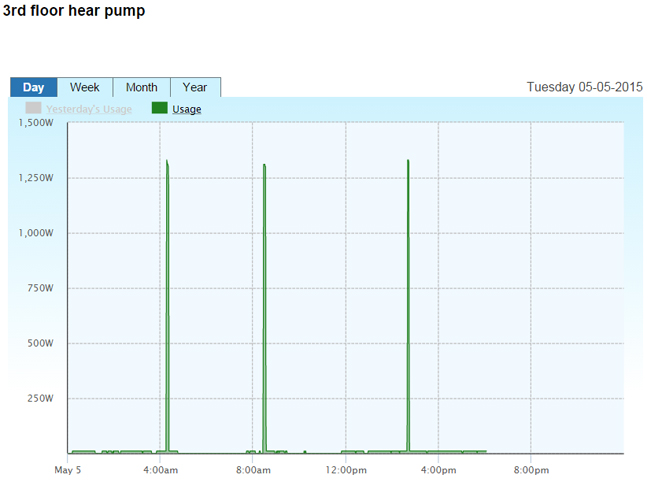 As with the entire building, there are charts displaying the energy used by individual circuits every day, week, month and year.
 As data collects and trends become apparent, this house will become one of a handful that teach us about our projects' energy consumption and help us design more energy efficient buildings. We look forward to seeing how this house operates!